 By Irene Isabel Payad Lim, MD and Michael Ford, MD
Faculty Peer Reviewed
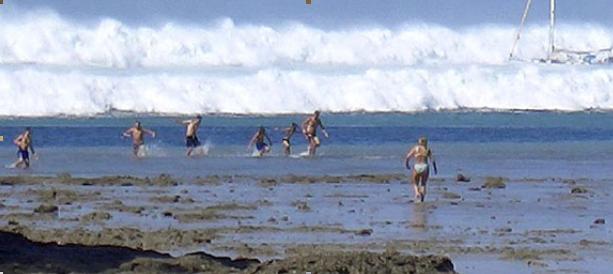
The February 27, 2010 earthquake in Chile measured 8.8 on the Richter scale and displaced nearly 2 million people[1]. It also threatened to generate tsunamis that were predicted to hit the coasts of Japan, the Philippines, and Hawaii some 7000 miles away. In this instance, the waves set off by the Chilean earthquake dissipated relatively harmlessly. On the day after Christmas 2004, however, 14 countries bordering the Indian Ocean were not as lucky. Thailand, Sri Lanka, and India were the hardest hit[2]. The tsunami decimated their shores without warning and killed 230,000 people. Originating from an offshore earthquake near the Indonesian island of Sumatra, the tsunami ended its destructive path on the East African shore, some 3000 miles away and seven hours after it began (Figure 1)[3].

Figure 1. Tourists fleeing the tsunami as it comes ashore at Hat Rai Lay Beach, Thailand. Agence France-Presse
In the aftermath of the Chilean quake, tsunamis were a prominent topic of conversation on our morning work rounds. Tsunamis and their formation may seem like an esoteric subject for daily rounds on the Bellevue medicine ward, and even more so for an internal medicine blog. The qualities of these powerful waves, however, have a connection with a daily part of the practice of medicine, blood pressure measurement. Once an art form touted by prominent scientists such as Ludwig and Korotkoff, blood pressure measurement has become such a commonplace practice that is often taken for granted. Upon cursory review, tsunamis may appear far removed from our everyday lives, but the turbulent tides of the Earth’s oceans share many similarities to the metaphorical tides brewing within each of us.
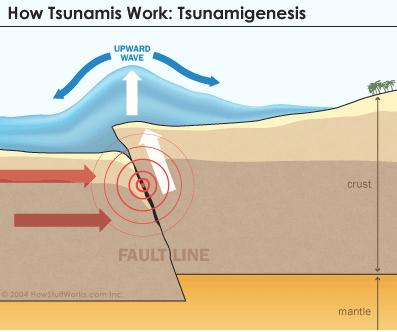
Tsunamis form in four stages: initiation, split, amplification and runup. The initiation begins with a submarine earthquake, during which the seafloor oscillates up and down[4]due to the increased pressure emitting from below. These vertical movements of the Earth’s crust can be quite large and cause the sea water to be displaced above the mean sea level (Figure 2). These events are so intimately tied that the main determinant of the initial size of a tsunami is the amount of vertical sea floor deformation[4]. The level at which the water is pushed above mean sea level is translated into the water’s potential energy. This newly-acquired potential energy is then transferred to kinetic energy, which is directly related to the water velocity squared. The following equations govern this phenomenon5:
Δ PE = Δ KE
KE = ( ½ ) (m) (v2)
where Δ = “change in”, PE = “potential energy”, KE = “kinetic energy”, m = “mass”, and v = “velocity”.
Figure 2: Seafloor movements in submarine earthquake result in upward seawater displacement [6]
As the tsunami progresses, the water gains its velocity not just from the kinetic energy gained from the earthquake but also from conditions surrounding its formation. Specifically, the tsunami’s speed varies directly with the square root of the water depth, thus making deep ocean tsunamis faster. In the Pacific Ocean, where certain points can reach a depth of 4000 meters, tsunamis can travel at speeds upward of 700 km/h, with wavelengths of more than 100 km. These parameters make a deep ocean tsunami akin to a very long, shelf of water moving across the ocean at the speed of a jet airplane! By Reynolds equation, the speed at which the water travels determines whether fluid flow is laminar (smooth) or turbulent (chaotic) [5]. The greater the velocity, the greater the Reynolds number, thus resulting in turbulent flow. The Reynolds equation is defined belo[5]:
Sea water can be imagined as fluid within an imaginary pipe in which the atmosphere and seafloor are the boundaries above and below, respectively. In a pipe, a Reynolds number above about 4,000 corresponds to turbulent flow, while a Reynolds number below 2,100 indicates laminar flow [5]. The region in between (2,100 < Re < 4,000) is called the transition region. In turbulent flow, unsteady fluid vortices appear and interact with each other[5]. (While ocean water can be conceived of as flowing in a pipe, the depth of the ocean floor varies considerably across its length, making it difficult to calculate pipe hydraulic diameter; thus, a determination of Reynold’s number for ocean waves is beyond the scope of this essay.)
The same principles that govern tsunami formation can be applied to the flow states of our own blood. Blood pressure, an indicator of the circulatory flow in the human body, can be measured by auscultation, automated (oscilloscopic) and invasive techniques. Though automated oscilloscopes are increasingly used in both the clinic and the hospital, the auscultatory method with mercury sphygmomanometers provides the most accurate non-invasive measurement of blood pressure[7].
In 1905, Nikolai Korotkoff was the first to observe the production of unique sounds by arterial constriction[8]. The auscultatory method relies on the first and fifth Korotkoff’s sounds, which are dependent on flow states that change at specific times[9]. The appearance of the first, faint tapping sounds is clinically correlated with the systolic blood pressure while the point at which all sounds disappear correlates with the diastolic blood pressure[9]. A recent study by Sykes, et al. used ultrasonics to definitively determine the cause of each sound[10]. They found that the first Korotkoff sound, known as Phase 1 or K1, coincides with large amplitude movements of the brachial artery as it begins to open from its collapsed position under external pressure from the cuff. This is analogous to the external pressure exerted by the submarine earthquake onto the body of water above it.
As the cuff is deflated, flow is restored through the brachial artery. The evolution of this flow is divided into further stages, Phase 2 through 5 (K2 to K5). K2 was found to coincide with high velocity jets of blood flowing through the brachial artery[10]. One could imagine that the blood, like sea water during tsunami formation, gains potential energy (and thus kinetic energy) from its displacement secondary to brachial artery narrowing due to increased pressure from the cuff. The kinetic energy then translates into an increase in velocity. Indeed, there is high velocity flow at this stage[9] and again, the Reynolds number can approach a value predicting turbulent flow. According to Sykes, et al, the Reynolds number correctly predicts turbulent flow as flow during K2 contains vortices[10], a characteristic of turbulence in fluids. On auscultation, K2 correlates with the onset of the murmur phase[10]. Clinically, any murmurs have been associated with turbulent flow (i.e. bruits in carotid artery stenosis), which is supported by this evidence.
Conversely, the absence of turbulent flow (and thus, presence of laminar flow) has been clinically associated with the absence of murmurs. In relation to Korotkoff’s sounds, the disappearance of sounds (at K5) has been historically related to the diastolic pressure. The ultrasonic study showed that at K5 there was a decrease in amplitude of arterial wall movements and the return of laminar flow10. The restoration of laminar flow, in turn, implies a decrease in velocity (by calculation of Reynolds number). These results suggest that disturbance of flow, as defined in stages by Korotkoff’s sounds, are directly related to brachial artery wall disturbances secondary to blood pressure cuff inflation and deflation. Similarly, disturbance of flow that results in tsunamis are directly related to seafloor disturbances secondary to submarine earthquakes.
Alternatively, one can imagine that sea water within an imaginary pipe (again, with the atmosphere and the sea floor as its superior and inferior boundaries), experiences the creation of a pressure gradient when the sea floor oscillates during an underwater earthquake. In this manner, the physics behind tsunami formation and blood pressure measurement can also be proven with Darcy’s law of blood flow. This law states that blood circulation is dependent on a pressure gradient [5]. The mathematical equation describing this relationship is defined below:
F = DP/R
where F = blood flow, DP = pressure gradient, R = resistance
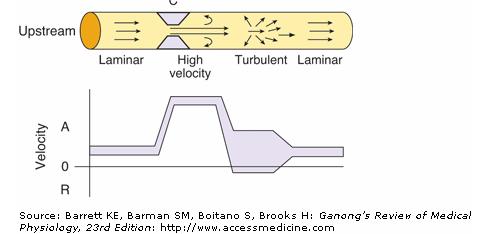
During blood pressure measurement, the inflated pressure cuff rapidly introduces a pressure gradient between two points along the brachial artery while simultaneously decreasing the artery’s radius (Figure 3), resulting in the turbulent flow of blood, which is detected by Korotkoff’s sounds. Similarly, a submarine earthquake introduces a pressure gradient through the elevation of water pressure above the mean sea level. The flow then changes from laminar to turbulent, and depending on other inciting factors such as water depth, can result in tsunamis. The only difference in the two situations is the causative, inciting factor for the presence of a pressure gradient.
Figure 3: Velocity in a blood vessel. Areas of high velocity and turbulent flow occur at points of high pressure and decreased radius [9].
Though tsunamis have enormous potential for destruction, the disturbance of blood flow in blood pressure measurement thankfully does not. This contrast can be attributed to the stark difference in magnitude of energy that is conferred, even though the production of that energy is notably similar in the two situations, as shown above. Ultimately, by employing the fundamental principles of fluid mechanics, the brachial artery wall disturbances in blood pressure measurement can be likened to disturbances of the sea floor in tsunami formation, leading to disturbances in blood and sea water flow, respectively. To our knowledge, we are the first to propose this relationship between a great natural phenomenon (tsunamigenesis) and the mechanics behind a key vital sign (blood pressure measurement).
Commentary: An Alternative View
By Leon Axel M.D., Ph.D. Professor; Departments of Radiology, Medicine, Physiology and Neuroscience, NYU Langone Medical Center
This is an entertainingly written essay, with a striking photo of an incoming tsunami, and it contains a nice review of some of the physical aspects of fluid flow in both tsunamis and Korotkoff’s sounds of blood pressure measurements. However, I am skeptical of some of the comparisons that are made between the rather different phenomena of tsunamis and the Korotkoff’s sounds.
It is certainly true that they both involve moving fluids, and they thus must be subject to the same underlying physical properties of fluid flow. However, the scales of the energies involved are greatly different in the two phenomena, and the relative roles of turbulence are also quite different.
As I understand it, in the generation of tsunamis, the unique aspect of them that differentiates them from an ordinary wave on the ocean, is that they involve a local vertical motion of essentially the whole depth of the ocean, a result of the immense forces produced by the lifting of the sea floor. In contrast, the motion of an ordinary ocean wave just involves the surface of the ocean. Thus, the kinetic energy involved in a tsunami is a result of not only the high speed at which it travels, but the fact that it is the whole depth of the ocean that is moving. In fact, the wave is actually apparently quite small in amplitude at the surface, while it is still in the open ocean. The Reynolds number is not really relevant here, as the fluid motion is not very turbulent when it is travelling across the open ocean. (In any case, the only boundary that would be relevant for drag on the fluid in calculating the Reynolds number would be the ocean floor, as the motion at the surface is unconstrained). As the wave approaches the shallower depths near the shore, all of the kinetic energy stored in the deep wave motion shows up as a growing amplitude of the wave at the surface, with the resulting great height of the wave at the water’s edge, with its associated destructive power. The breaking wave is turbulent, of course, but so is an ordinary breaking wave; it is not the turbulence, per se, that distinguishes a tsunami, but rather the amount of energy involved in it.
In the Korotkoff’s sounds, the source of the audible sounds is the turbulence that is associated with flow through a narrowed artery in certain flow regimes, as nicely described in the essay. However, source of the energy dissipated in that turbulence is the contracting heart upstream, not the compressing cuff at the local constriction of the artery. Thus, the analogy being made between the forces of the blood pressure cuff and the lifting ocean floor as causes of the two phenomena is, I feel, confusing.
In summary, the descriptions of the two separate phenomena are reasonably well done in the essay, but I feel that the comparison that is being made between them is a bit far fetched and potentially confusing.
Dr. Lim is a 4th year medical student at NYU School of Medicine
Dr. Ford is a 3rd year resident at NYU Langone Medical Center
Peer review and commentary by Leon Axel M.D., Ph.D. Professor; Departments of Radiology, Medicine, Physiology and Neuroscience, NYU Langone Medical Center
Image courtesy of Wikimedia Commons (2004 Indonesia Tsunami)
References:
1. Barrionuevo A. and Robbins L. 1.5 Million Displaced After Chile Quake. New York Times (New York Ed.). 2010 Feb 28: Sect. A:1. http://www.nytimes.com/2010/02/28/world/americas/28chile.html?pagewanted=1
2. Cumming-Bruce N. and Robertson C. Most Powerful Quake in 40 Years Triggers Death and Destruction. New York Times (International Ed.). 2004 Dec 26. http://www.nytimes.com/2004/12/26/international/asia/26cnd-quak.html?pagewanted=1&sq=tsunami%202004&st=cse&scp=42
3. Revkin AC. How Scientists and Victims Watched Helplessly. New York Times (International Ed.). 2004 Dec 31. http://www.nytimes.com/2004/12/31/international/worldspecial4/31wave.html?pagewanted=1&sq=tsunami%202004&st=cse&scp=7
4. Levin B, Nosov M. Physics of Tsunamis. Netherlands: Springer Science, 2009: 1-10, 77-94.
5. Fox RW, McDonald AT and Pritchard PJ. Introduction to Fluid Mechanics. 7th ed. New York, NY: Wiley, 2008: 35-40, 328-336.
6. Valdes R and Halabrin N. “How Tsunamis Work.” 04 January 2005. HowStuffWorks.com. http://science.howstuffworks.com/tsunami.htm> 7 March 2010.
7. Canzanello VJ, Jensen PL and Schwartz GL. Are aneroid sphygmomanometers accurate in hospital and clinic settings?. Arch Intern Med. 2001 Mar 12;161(5):729-731.
8. Pickering TG, Hall JE, Appel LJ, et al. Recommendations for Blood Pressure Measurement in Humans and Experimental Animals: Part 1: Blood Pressure Measurement in Humans : a statement for professionals from the Subcommittee of Professional and Public Education of the American Heart Association Council on High Blood Pressure Research.. Circulation. 2005 Feb 8;111(5):697-716.
9. Barrett KE, Barman SM, Boitano S, Brooks H, “Chapter 32. Blood as a Circulatory Fluid & the Dynamics of Blood & Lymph Flow” (Chapter). Ganong’s Review of Medical Physiology. 23rd ed. New York, NY: McGraw-Hill Medical, 2009: 521-554.
10. Sykes DA, McCarty K, Mulkerrin E, et al. Correlation between Korotkoff’s sounds and ultrasonics of the brachial artery in healthy and normotensive subjects. Clin Phys Physiol Meas. 1991 Nov 1;12(4):327-331.


One comment on “Tsunamigenesis and Korotkoff’s Sounds”
this is a provocative post. i feel, however, that the explanation of the genesis of korotokff sounds is a bit confusing with regard to cause and effect. the independent variable is the area of the artery (what the clinician alters), the dependent variable is the velocity of the blood (and hence turbulence and sound). blood flow can be imagined as an infintesimally small mass of blood (the artery’s area multiplied by the length of this ‘piece of blood’) over time. this can be restated as flow = area x velocity. hence as the artery is narrowed (area lessens) and assuming flow is the same on both sides of the narrowing, velocity must increase. (this is like putting your thumb over the end of a flowing garden hose – causing a jet). hence, velocity (and kinetic energy) is the dependent variable and is determined by the area of the artery (the blood pressure cuff). the increased velocity results in an increase in kinetic energy distal to the narrowing, and a concomitant DECREASE in potential energy (because of the law of energy conservation). hence, the area just distal to the narrowing is a LOW pressure system and this also explains why bacteria and thrombi preferentially stick to the side of a valve distal to a regurgitant jet…because of the low pressure. this principle is a friend from the physiology classroom – and bears the name of of its first descriptor – bernoulli.
Comments are closed.